Analytics part 1
Designing a 0-1, 360° Security Insights Analytics Platform
Allow customers to access, visualize and share the right metric types to make data driven decisions.
Company context
Ambient.ai
Enterprise SaaS, Physical Security, Computer Vision
Security monitoring is overwhelming.
Ambient.ai alerts customers of notable activity by watching 1,000s of camera footage so security professionals don't have to.
Project overview
Role
Design lead
Stakeholders
12
Timeline
5 months
Problem context
USER NEEDS
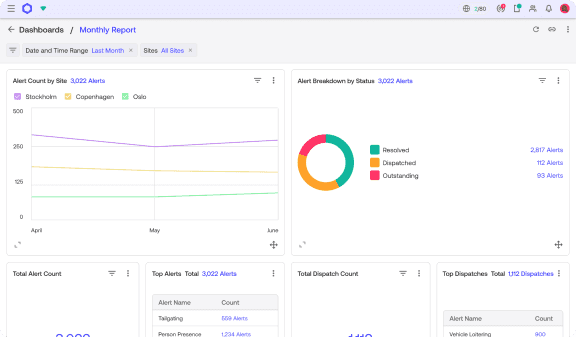
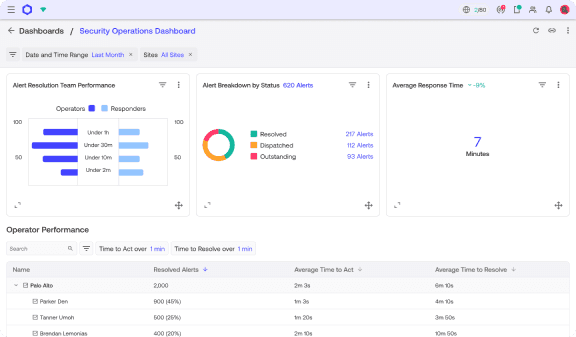
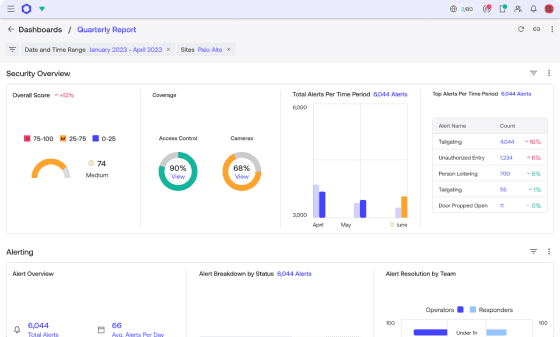
Customers want analytics over their entire security posture, not just alerts.

Are all my cameras up and running?

Do we have enough staff on each site?

Which alerts are causing the most trouble?
business context
Dashboards are underutilized—a key retention feature threatening churn and turning prospects away.
Design objective
How might we
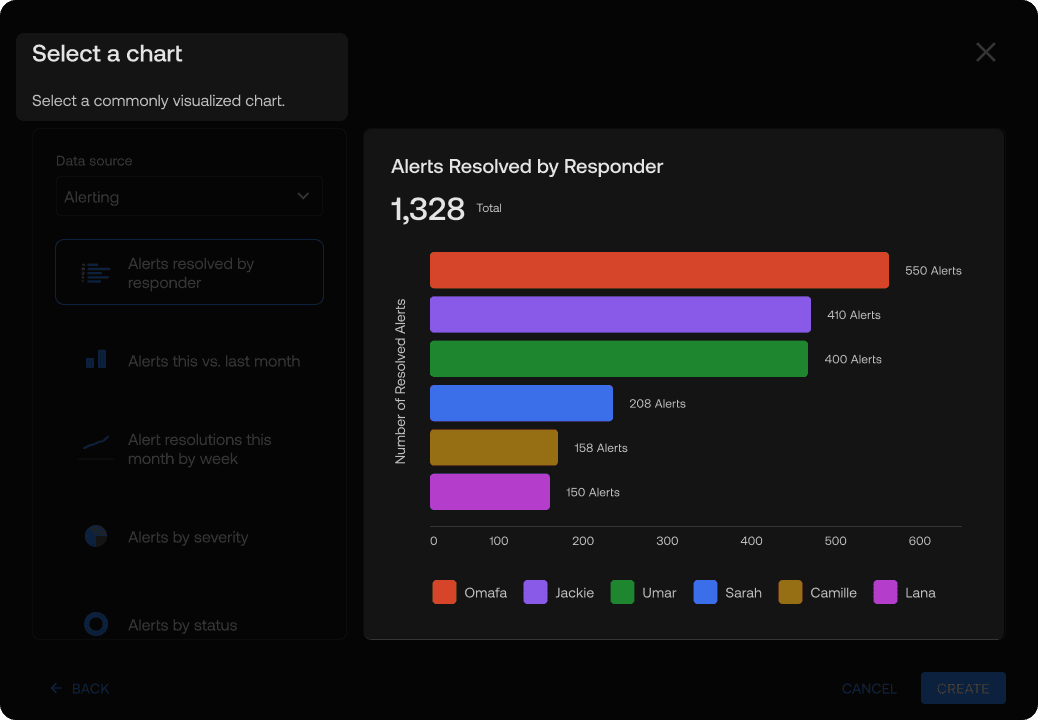
Create a dashboard and charting experience for security professionals to monitor alerts & key security trends?
Design & development
ITERATION 1


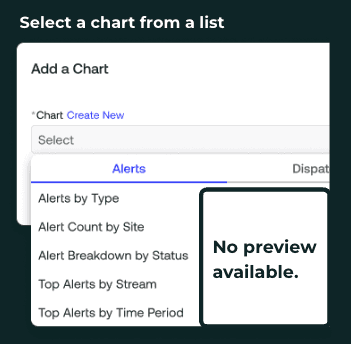
Create a chart
Select a chart

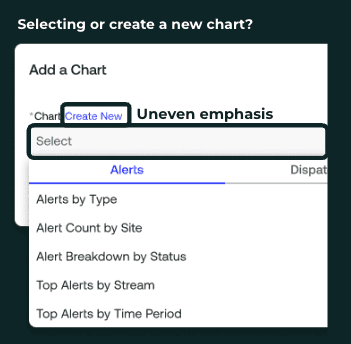
Equalize the entry points between the two types of charting experiences.

Before
After
ITERATION 2
Impact & outcome
Customers can create custom & comprehensive dashboards and charts that report on various security insights beyond alerting.
ACCOUNTS RETAINED
7
31% INCREASE in dashboard ENGAGEMENt—unique views/mo
1,000 MAU
1,310 MAU
20% reduction in support tickets

